Pre-Lab (PDF)
Lab 7 Description (PDF)
The main topic of this lab is the dynamics of circuits with operational amplifiers, op-amps. Students also get experience with hooking up op-amp circuits and seeing these in the context of feedback loops. The circuits that are used in this lab are shown in figure 1.

Figure 1. Idealization of the RLC circuit used in this lab.
We fix R2 = 470 kω, Ra = 1 kω and C = 0.1 μF. R1 is set to produce a specified gain. Here we choose R1+R2 >> Ra so that the loading on the RaC network can be ignored. We use the very common LM 741 op-amp in these circuits. Most op-amps are well-modeled an integrator with a high gain (transfer function: a(s) = G/s). For the 741, G is approximately 6 x 10⁶. The circuits in figure 1 can be modeled by the following block diagrams in figure 2.

Figure 2. Block diagram models of op-amp circuits used in this lab
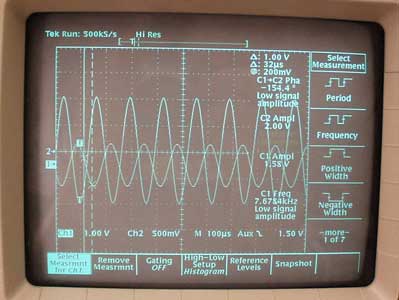
By studying step responses and determining time constants, students can compare their predictions of the circuit behavior with the actual behavior. Circuit (a) is essentially first order. By adding the RC filter inside the loop circuit (b) we realize an underdamped second-order input-output response. After adding this filter, predictions on locations of the poles of circuit (b) can be compared with measurements. The actual frequency response can be measured easily by using the function generator to provide a sine input. As described in lab 6, differences in magnitude and phase between input and output can be made clear by an oscilloscope that shows both the sine wave input and output. This is most readily accomplished if the oscilloscope can automatically measure magnitude and phase, as shown on the screen.

Figure 3. The sine input and output, showing the magnitude and fase shift at a certain frequency.