Click on the image to begin the animation.
Boundary Conditions Animation
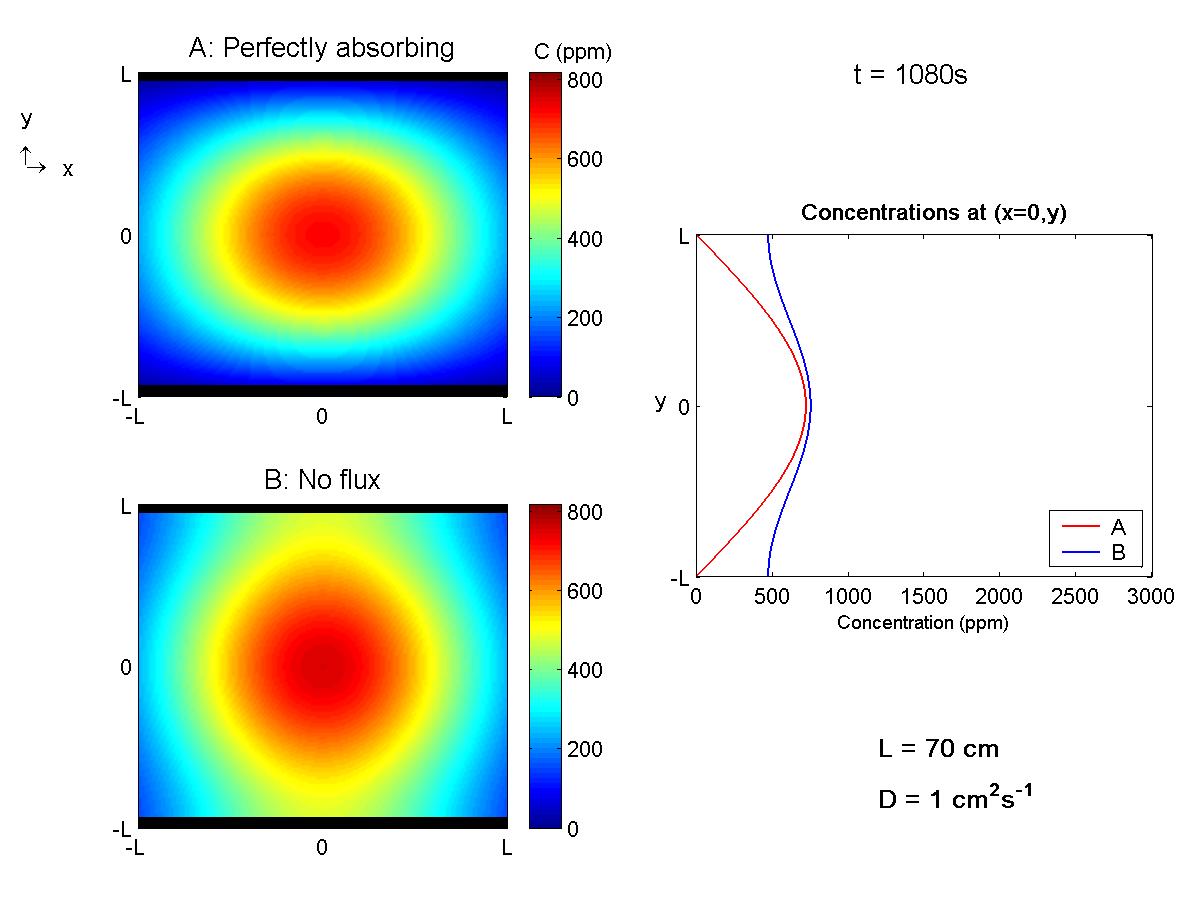
Output of MATLAB® software.
The following animation examines the evolution of concentration after a slug mass is released mid-way between solid, parallel boundaries. Two scenarios are considered, perfectly absorbing and no-flux boundaries. For each system the concentration field is displayed in the plane z = 0. In addition, the concentration profile C(x = 0, y, z = 0) for each system is plotted for comparison on a single graph. For some background and thought problems pertaining to this animation, review the theory (page 8) behind modeling the effect of no-flux and perfectly absorbing boundaries.
* Note to Unix users: the animation opens up behind active windows
MATLAB® is a trademark of The MathWorks, Inc.