
Search
Now showing items 1-6 of 6
Research Brief: Validation of Molecular Dynamics-Based Structural Damage
(2019-03)
Windstorms currently generate $28 billion in average annual damage and this figure is projected to potentially rise to $38 billion by 2075. Traditional engineering approaches that analyze the resilience of structures fail ...

Research Brief: Generating Component-level Building-specific Fragility Curves
(2020-11)
One of the most essential tools for representing the vulnerability of a structure is the fragility curve. By capturing the probability of damage at a given load level, fragility curves provide a way to express how a ...
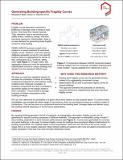
Research Brief: Generating Building-specific Fragility Curves
(2019-05)
Fragility curves represent a structure’s likelihood of damage under a range of load levels—like those from natural hazards. They, therefore, help to set building code safety factors, resiliency ratings, and even insurance ...
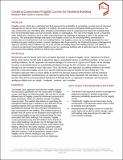
Research Brief: Creating Customized Fragility Curves for Resilient Building
(2018-11)
Fragility curves, which are a statistical tool that represent the probability of exceeding a certain level of structural damage due to various forces applied to a building, are used to assess anticipated building performance. ...

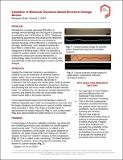
Research Brief: Molecular Dynamics-based Resilience Assessment of Structures
(2020-07)
According to the National Fire Protection Association (NFPA), losses due to fire in structures in America amount to around $13 billion annually. Despite these severe economic consequences, building codes often don’t ...

Research Brief: A Resilience Assessment of Structures Using Molecular Dynamics
(2018-06)
Between 1993-ˇ2012, more than 75% of catastrophic losses in the United States were caused by windstorms
(1). The Congressional Budget Office estimated an average annual damage amounting to $28 billion (0.16 percent of GDP), ...