| dc.contributor.author | Gralla, Erica | |
| dc.contributor.author | Blair, Courtney | |
| dc.contributor.author | Wetmore, Finley | |
| dc.date.accessioned | 2022-05-26T01:40:19Z | |
| dc.date.available | 2022-05-26T01:40:19Z | |
| dc.date.issued | 2022-05-26 | |
| dc.identifier.uri | https://hdl.handle.net/1721.1/142763 | |
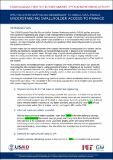
| dc.description.abstract | System maps can be invaluable tools for organizing and visualizing data. As demonstrated here, adding data to the system map for agricultural finance made it easier to identify three important insights about the system, based on the status of key pathways. The data overlaid on the map was particularly critical in showing that physical access to loans was not, as many assumed, the primary barrier to greater uptake of agricultural loans
. The map showed moderate and increasing access, yet loan uptake had not increased accordingly. Overlaying diverse data sets on a depiction of causal pathways was critical to noticing and “debunking” this commonly held assumption.
The map could
further be used to identify barriers to change and potential areas for investment,
both of which
serve to generate actionable recommendations for development practitioners to achieve various key
system outcomes. | en_US |
| dc.description.sponsorship | USAID | en_US |
| dc.language.iso | en_US | en_US |
| dc.rights | Attribution-ShareAlike 3.0 United States | * |
| dc.rights.uri | http://creativecommons.org/licenses/by-sa/3.0/us/ | * |
| dc.subject | USAID | en_US |
| dc.subject | System Mapping | en_US |
| dc.subject | Uganda | en_US |
| dc.subject | Finance | en_US |
| dc.title | Understanding Smallholder Access to Finance | en_US |
| dc.type | Working Paper | en_US |