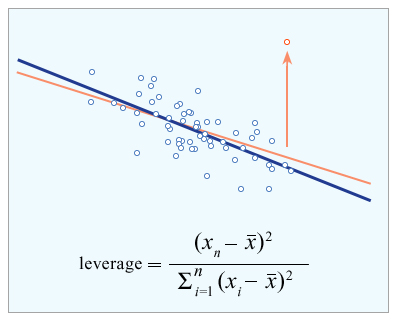
The "leverage" quantifies the potential influence of a "response variable" on the slope of the least-squares line, as a function of a "predictor variable". It is the square of the correlation between the response variable and the slope when the predictor variable is held constant. (Image by Dr. Michael Hardy.)
Course Highlights
Course Description
Reviews probability and introduces statistical inference. Point and interval estimation. The maximum likelihood method. Hypothesis testing. Likelihood-ratio tests and Bayesian methods. Nonparametric methods. Analysis of variance, regression analysis and correlation. Chi-square goodness of fit tests. More theoretical than 18.443 (Statistics for Applications) and more detailed in its treatment of statistics than 18.05 (Introduction to Probability and Statistics).